


اسئلة الجداول تكون دائما فيها عناصر وتفاصيل كثير يمديك تكتب عنها.. كل اللي عليك تسويه انه تحدد المجموعات اللي راح توصفها وتستخدم القالب واكيد راح توصل للـ ١٥٠ كلمة بالراحة..
وهذي بعض الأمثلة على شكل سؤال رسوم الجداول
اتفقنا راح نستخدم هذا القالب “اهم تكنيكة في الكتابة” لحل هذا النوع من الرسوم..
ودحين خليني اوريك مثالين من مشاركتكم تم حلهم باستخدام القالب 🤸🏻♀️
المثال 1️⃣
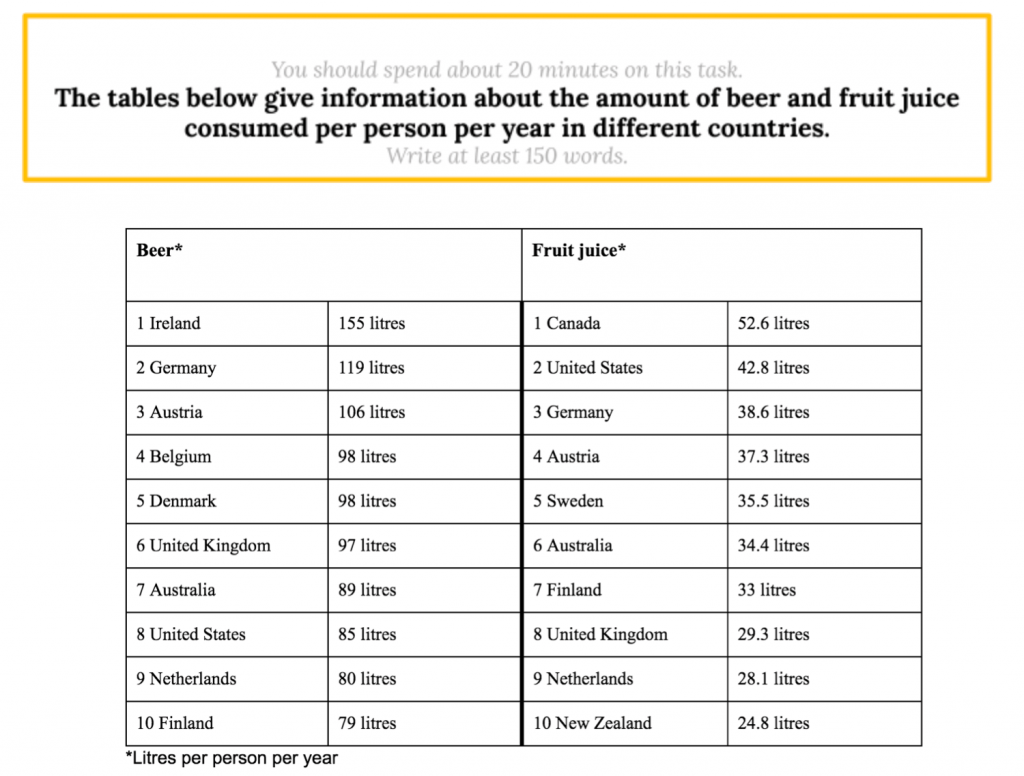
These tables depict the annual consumption per person of both beer and fruit juice in different countries. It is clear from the table that Ireland and Canada have the highest annual consumption of beer and fruit juice respectively.
According to what is shown, Ireland and Germany have the highest annual consumption of beer of 155 and 119 liters respectively. Although Austria comes next in order of beer utilization, the other countries consume an average of 90 liters annually with Finland consumes the least at 79 liters.
Fruit juice, on the other hand, Canada and the United States account for a significant annual consumption of 52.6 and 42.8 liters respectively, while Netherland and New Zealand consume the least; hovering around 28 and 24 liters respectively. The other countries have nearly the same consumption rate per year of the same beverage.
To sum up, we could say that the countries consume higher quantities of beer than fruit juice annually.
إذا حاب تشوف التصحيح كامل مع تعليق المصحح على الاخطاء اضغط هنا
المثال 2️⃣
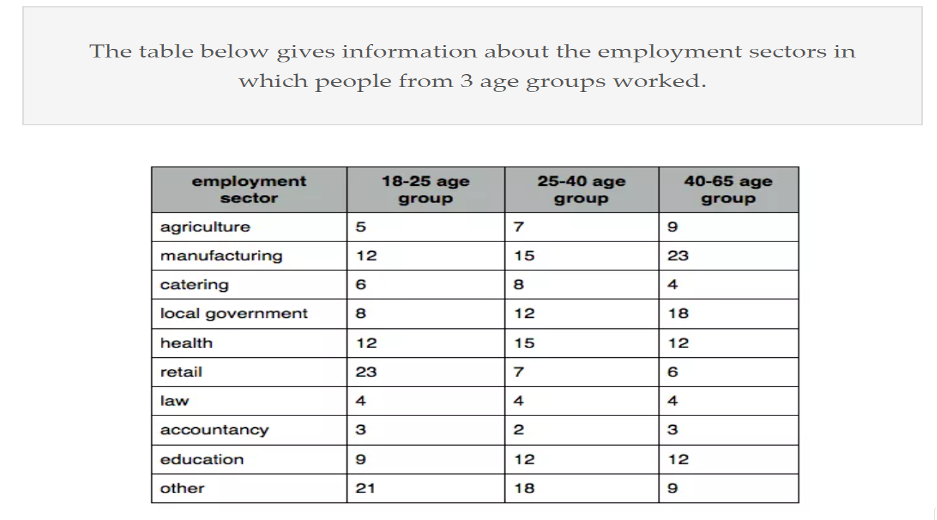
Some information about the percentage of workers from three different age groups, who operated in ten various sectors is illustrated in the table below. It is clear from the graph that, accountancy had the lowest number of workers throughout all ages.
According to what is shown, most of the 18-25 age group’s workers had worked in retail jobs at about a quarter, in contrast to accountancy, law, and, agriculture fields, which were the less preferred jobs at 3%, 4%, and, 5% respectively. However, most of the other main sectors had an average of 6 to 20 per cent.
On the other hand, the second class of age had a tiny fraction of workers in the law. However, an equal number of workers had worked in the manufacturing and health sectors at 15%, and similarly, with agriculture and retail at 7%. Moving to the last group, it is noticeable that a higher number of them preferred to work in manufacturing at 23%, following by 18% for the local government professions.
To sum up, we could say that retail jobs were more popular among young people, while the manufacturing sector had a higher number of old people. However, 25 to 40 age group had good congruity.
إذا حاب تشوف التصحيح كامل مع تعليق المصحح على الاخطاء اضغط هنا
إذا استفدت شارك هذا المقال 💛
وإذا عندك اي سؤال ارسلي في تويتر من هنا


0 تعليق