


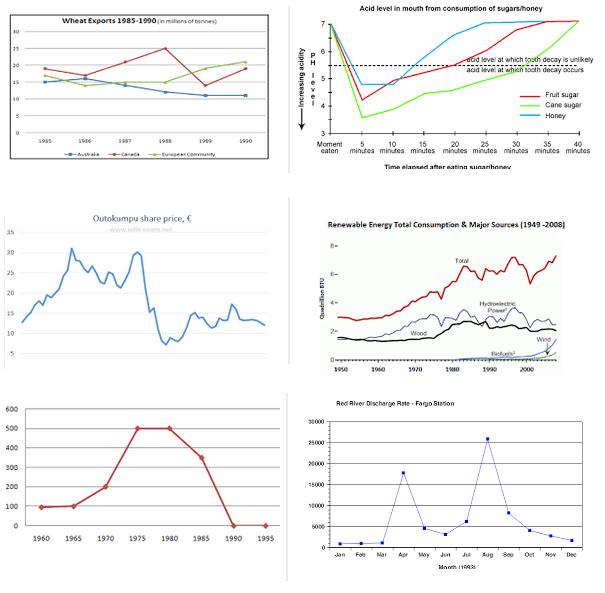
هذا النوع من الرسوم اسمه Line chart او الرسوم الخطية.. ويعتبر من انواع الرسوم الشائعة في الاختبار.
ممكن يجي خط واحد او اكثر من خط في نفس الرسم.. وهذي بعض الأمثلة على شكل سؤال الرسوم الخطية..
اتفقنا راح نستخدم هذا القالب “اهم تكنيكة في الكتابة” لحل هذا النوع من الرسوم..
ودحين خليني اوريك مثالين من مشاركتكم تم حلهم باستخدام القالب 🤸🏻♀️
المثال 1️⃣
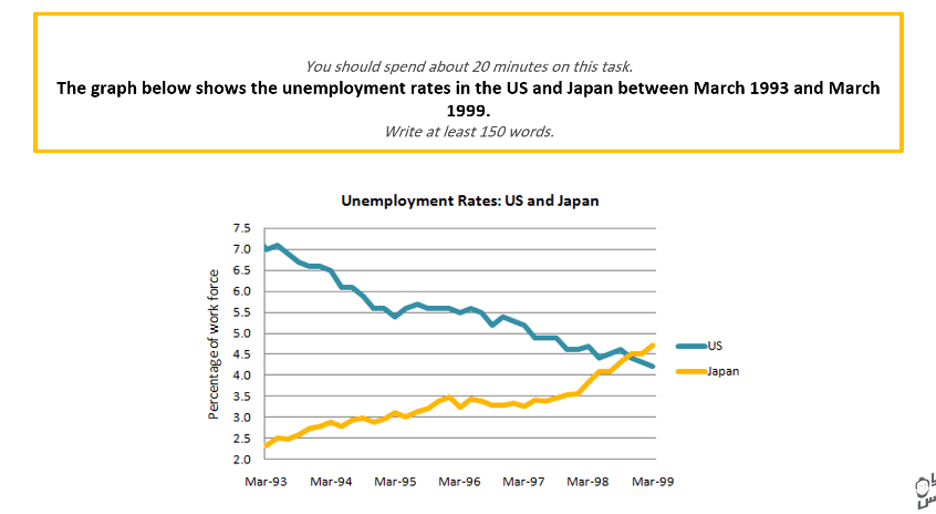
The proportion of unemployment is depicted in the line chart below in America and Japan over 60 years. It is clear from the graph that both countries’ percentages were going in the opposite direction.
According to what is shown, the USA and Japan had started at around 7% and 2.5% respectively. As there was a significant dip in the unemployment ratio in the USA during the first three years, there was a gradual climb in Japan’s ratio.
Thereafter the USA’s proportion fluctuated wildly at about 5.5 percent until nearly the beginning of 1997, while the proportion in Japan was increasing in the same period. Consequently the two countries’ ratio continued its usual behavior until March-1999 when Japan exceeded the USA at about 4.5% and 4% respectively.
To sum up, we could say that the number of unemployed people increased for Japan and dropped for America throughout the period until 1999 when Japan was almost 0.5 percent more than the USA.
إذا حاب تشوف التصحيح كامل مع تعليق المصحح على الاخطاء اضغط هنا
المثال 2️⃣
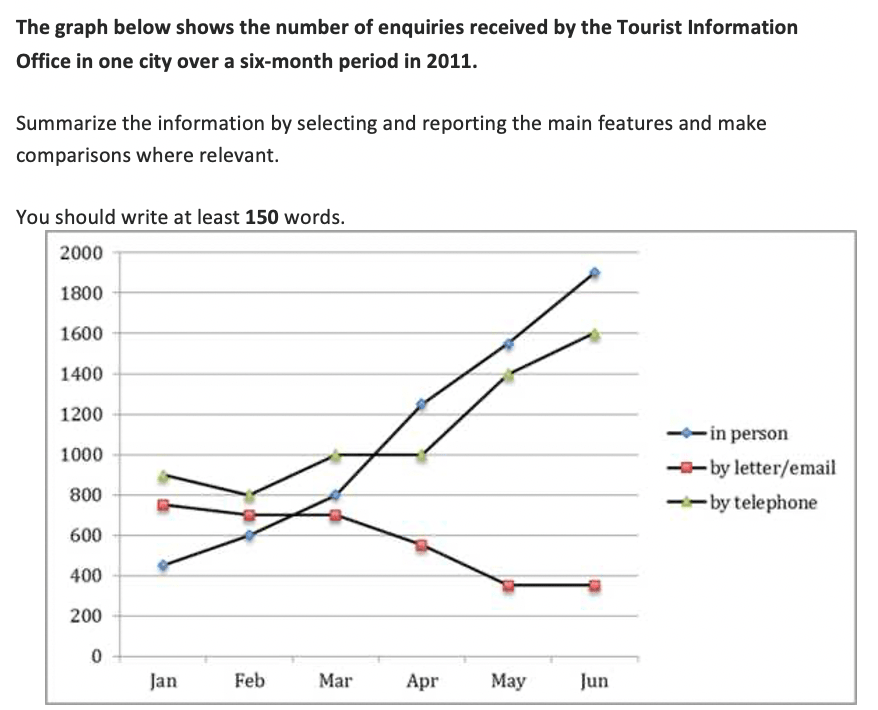
This line chart depicts the number of information questions asked by tourists in one city from January to June in 2011. It is clear from the graph that questions in person and by telephone were increasing during this period while by letter or email were decreasing.
According to what is shown, enquiries by letter or email sustained between 700 to 800 from January to March. Then, it sharply declined to half percent and remained steady to June. However, enquiries by telephone and in person were nearly similar in February.
After that, in person questions rocketed to its peak in June as it reached 1800 questions. Questions by telephone fluctuated at the beginning of this period. After it remained constant from March to April, it significantly climbed to 1600 in June.
To sum up, we could say that the number of information questions from January to March were almost the same, then both unwritten enquiries soared in June
إذا حاب تشوف التصحيح كامل مع تعليق المصحح على الأخطاء اضغط هنا
إذا استفدت شارك هذا المقال 💛
وإذا عندك اي سؤال ارسلي في تويتر من هنا


0 تعليق