


هذا النوع صراحة ما اسميه نوع سابع لانه هو باختصار عبارة عن رسمتين مع بعض مهو نوع صعب ومعقد.. كل اللي عليك تسويه تستخدم القالب وتبدأ توصف البيانات اللي في الرسم زي كأنه رسمة واحدة.
وهذي بعض الأمثلة على شكل سؤال الرسوم المتعددة
اتفقنا راح نستخدم القالب “اهم تكنيكة في الكتابة” لحل هذا النوع من الرسوم..
المثال 1️⃣:
These figures depict the proportion of journeys made by five different forms of transport in three different nations and the most cited reasons the Canadian individuals travel by car to work. It is clear from the graphs that the highest percentage shown on the table chart is for car in all countries.
According to the table chart, there is a high proportion of journeys made by car in Canada, Belgium and Germany, accounting for about 90%, 72% and 68% respectively. Meanwhile, the figure for on foot in Belgium and Germany remained at the same level, representing approximately 11%.
WWhile in the bar chart, the figure for no alternative is the greatest proportion, constituting more than 35%. However, the figure for work nightshift is the smallest proportion, accounting for only 7%.
To sum up, we could say that the tiniest figure shown on the table chart is for other in Canada and Germany, compared with the other forms of transport.
إذا حاب تشوف التصحيح كامل مع تعليق المصحح على الاخطاء اضغط هنا
المثال 2️⃣:
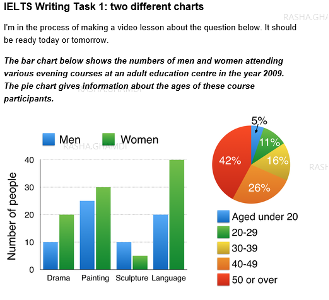
The bar chart depicts, on the one hand, the ratio of males and females participating in different educational courses in 2009. It is clear from the graph that the pie charts reveal that the ages of all the attendees in the evening sessions was from under 20 until 50 or over years old.
According to what is shown in the first chart, the percentage of women was doubled for men in the Drama as well as Language sessions. Moreover, the number of women was higher than men by 10 participants in the Painting class. However, the ratio of females attending Sculpture class was lower than males.
In addition to the percentage of the gender attendees. It is interesting to notice that the lowest aged category attending the evening courses was the aged below 20 years old. A striking point is that this percentage increased substantially as well as increasing ages.
To sum up, we could say that the two graphs highlight a considerable difference in the number of participants based on two factors which are the type of the course and the age of the participant.
إذا حاب تشوف التصحيح كامل مع تعليق المصحح على الاخطاء اضغط هنا
إذا استفدت شارك هذا المقال 💛
وإذا عندك اي سؤال ارسلي في تويتر من هنا


0 تعليق